
4:45
The Onshape Performance Panel is a handy performance analytics tool that provides users with detailed information about items such as their connection, tab graphics, Document performance, Part performance and Assembly performance.
If you’re wondering how many triangles are being generated to create your Assembly, what your Assembly mate solve time is, or you simply want to check if you have a good connection, the Performance Panel can answer those questions for you.
What Is the Onshape Performance Panel?
The Onshape Performance Panel () is located on the left side of a Document and includes five sections:
This article will break down what you can find in each section and how it can be useful to you.
Tab Performance
The tab performance section is only available in a Part Studio tab or an Assembly tab. An Assembly tab provides a count of items in that Assembly tab, while a Part Studio tab provides a count of features in that Part Studio. This information can provide an overview of how much data there is to generate when working in that particular tab. This section also provides the total time it takes to regenerate data when working in a Part Studio tab and the total time it takes to solve all the mates in an Assembly tab.
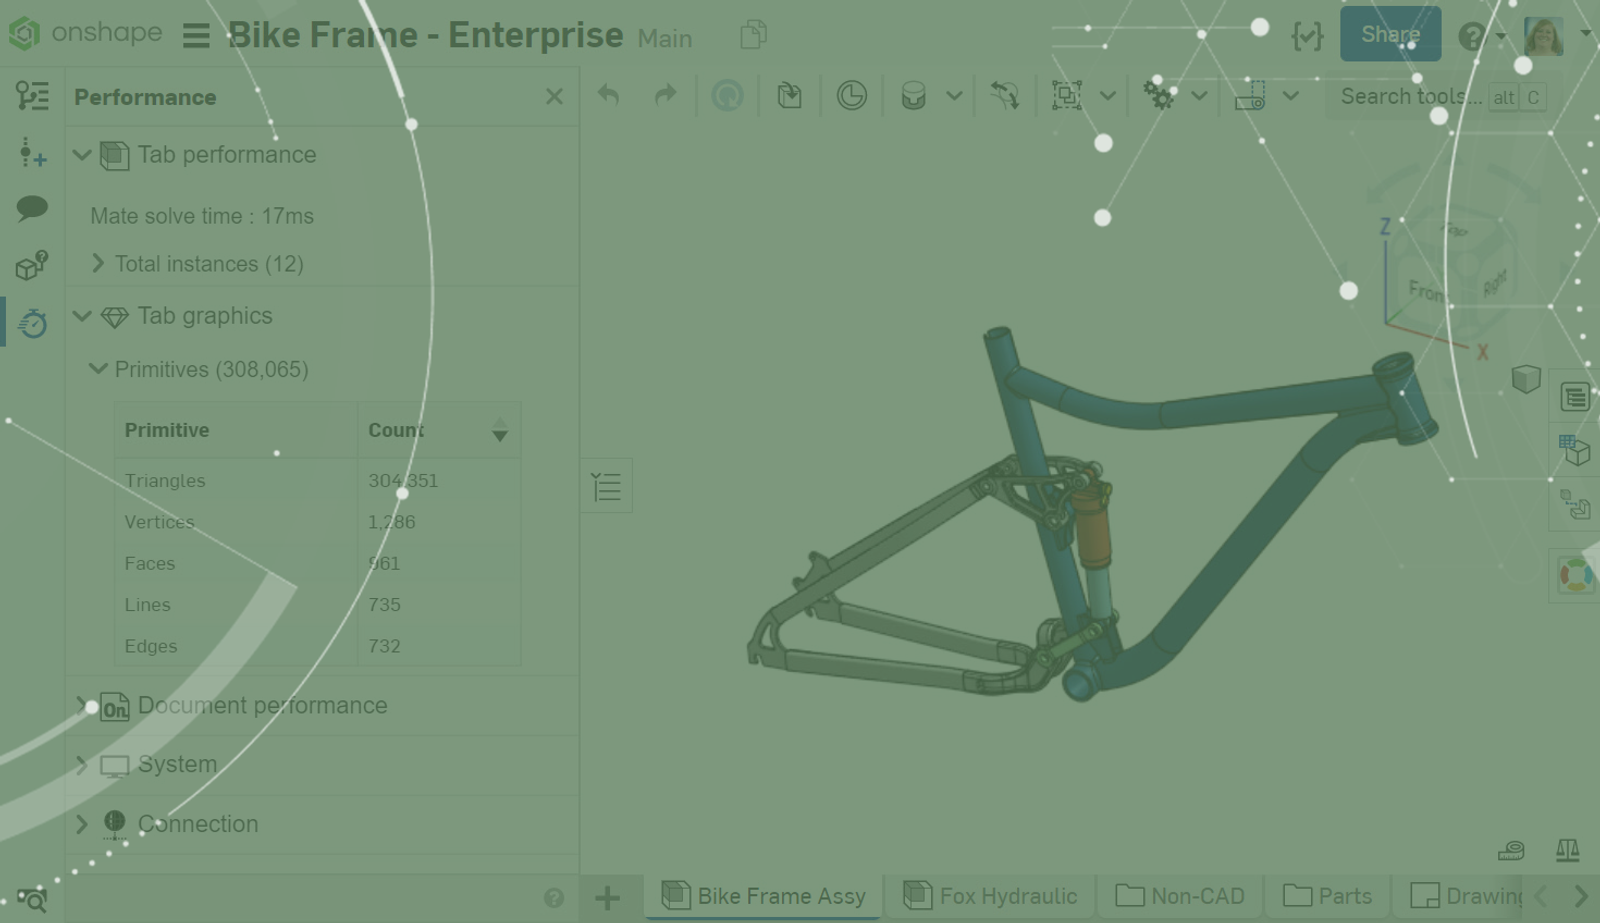
Tab Graphics
The tab graphics section is available in a Part Studio tab or an Assembly tab. This section provides a breakdown of the primitives used to create the 3D renderings you see. Triangles are graphics primates used to render faces and parts; this rendering is handled by your graphics card. The counts for vertices, faces, edges and lines in the tab are also provided. This information gives us a deeper understanding of what the time to regenerate consists of. The more triangles, for instance, the longer a regeneration is going to take.
Document Performance
The document performance section functions as a quick reference for how many tabs and what types of tabs the current Document contains. The line item “Other Tabs” refers to all other types of tabs such as: applications, imports and images.
System Performance
The system section of the Performance Panel contains information about the browser you’re using, what version the browser is, the operating system you’re on, GL vendor, GL renderer and WebGL information (Web Graphics Library).
This section is a quick reference for whether or not your system has all the WebGL extensions needed for quality graphics and 3D rendering. If your system doesn’t have all the GL extensions, this should be addressed for best graphics and 3D rendering.
Connection Performance
The connection section tells you three things: the latency, region and expected region.
- Latency informs you of the amount of time it takes for data to be transferred between the Onshape server and your machine.
- Region tells you what Onshape server region you are connected to, and
- Expected region tells you which Onshape server is the closest to your location. Typically you will be connected to the region closest to you, but there are occasions where the traffic might be routed to a region nearby that is not the closest.
Performance Panel Common Messages
Whenever the Performance Panel identifies a performance issue an icon appears next to the cause. You can click on the icon to bring up additional information.
Some common message triggers are:
Feature Regeneration Time: This message warns you that a specific feature in a Part Studio takes longer than 10 seconds to generate. The major performance impacts to consider with this message include: feature setting apply per instance, derive, and derive parts from versions. You can save regeneration time by not enabling “apply per instance” in a pattern, for example.
This option will calculate each pattern instance instead of calculating the first instance and applying the same calculation for every instance in the pattern. When deriving parts, be sure to not derive a part into multiple Part Studios using the method known as daisy-chaining. When deriving a part, always derive from the original part instance. Additionally, derive parts from a version instead of a workspace to reduce the amount of regeneration.
Assembly Solve Time: This message warns that the amount of time needed to solve all the applied mates is high. You should consider inserting a version of a complex part instead of the workspace and make use of subassemblies. Subassemblies create a hierarchy for mates to load, which improves mate solve times. Additionally, using mates with fewer degrees of freedom and reducing the use of mate limits speeds up the mate solve times. Another action to consider is simply suppressing the mate until it’s needed when working in the Assembly.
Amount of Tabs in a Document: Documents with higher tab counts can slow down the performance of the Document, it is advisable to keep Documents to a tab count below 100. Utilize modeling in-context and move tabs to other documents. Having tabs in other documents can also provide greater control over how and when you share a design.
Network and Region Issues: If the region differs from the expected region, most often this is due to the user being on a VPN. In that case, Onshape will detect the VPN server’s location as your location.
More Onshape Resources
This Tech Tip showed you how to access and understand the Performance Panel. If you want to learn more, we have more resources about performance considerations here.
We also have more tips and tricks to turbocharge performance and speed in Onshape. Check it out.
Interested in learning more Onshape Tech Tips? You can review the most recent technical blogs here.
Latest Content
- Blog
- Becoming an Expert
- Assemblies
Built to Scale: Why Large Assemblies Don’t Slow Down in Onshape
07.16.2026 learn more- Blog
- News from Onshape @ PTC
- Artificial Intelligence
Onshape Labs: AI in CAD Guided by Designers, Driven by Innovation
07.15.2026 learn more- Blog
- Evaluating Onshape
- Data Management
- Collaboration
- Artificial Intelligence
How the Most Underrated CAD Feature Improves Design Workflows
07.09.2026 learn more