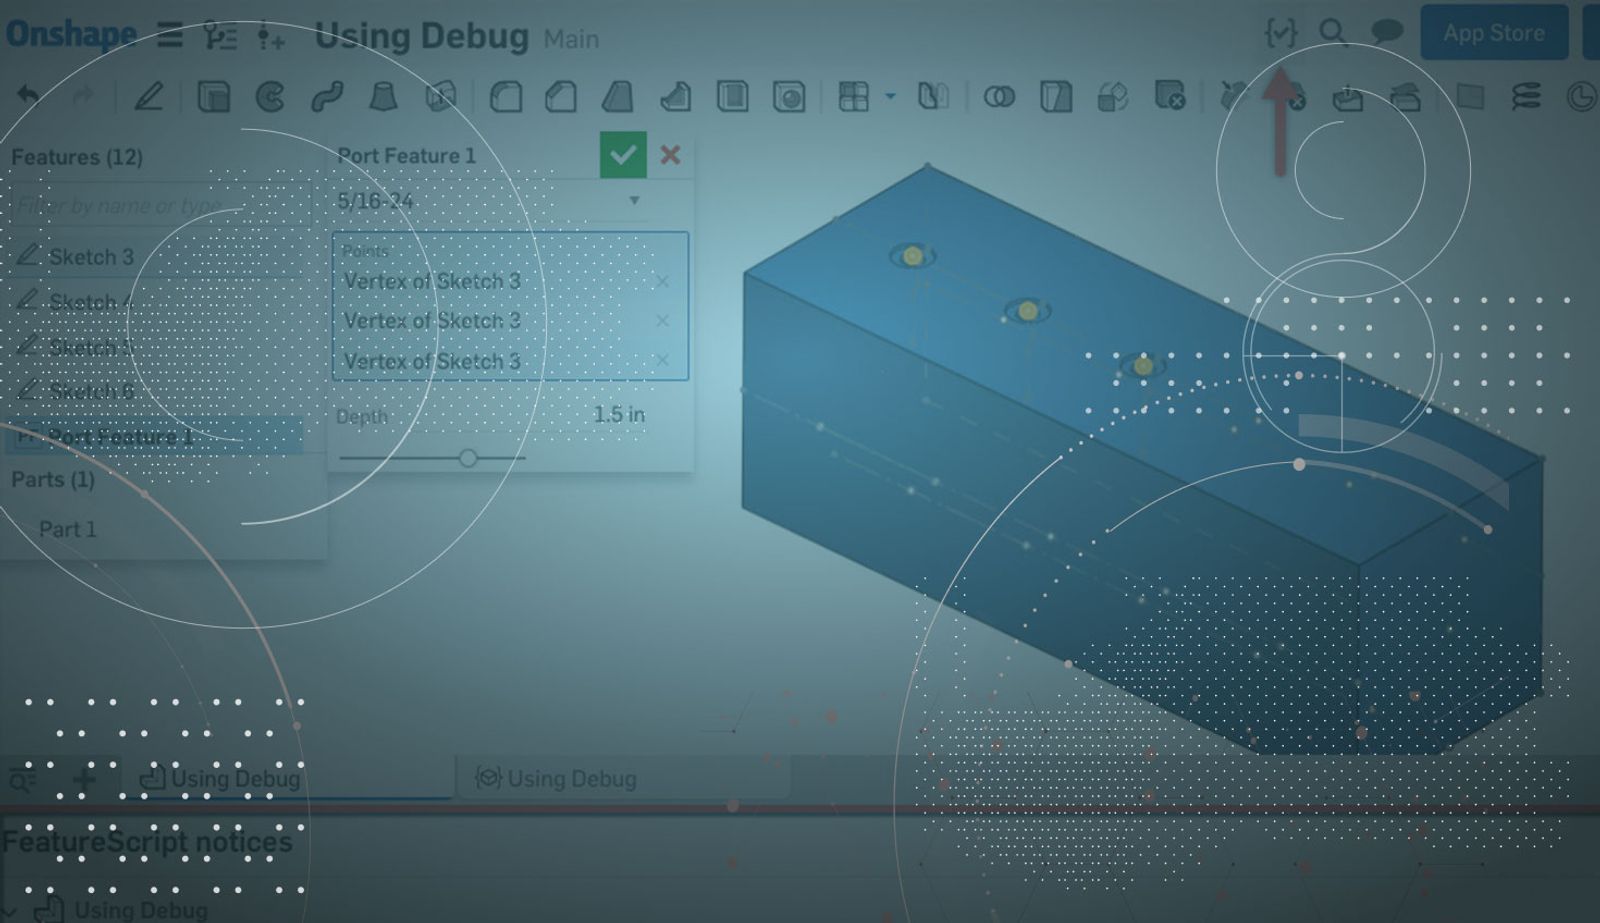
1:29
One of the most useful features for troubleshooting FeatureScript code is the debug function. Let’s take a look at how to use it!
Debug is very easy to use. First, simply add a new line to your Feature Studio and type
debug (context, value);
Here “value” is whatever you are trying to debug. Here is an example of debug in use:
Here I’m debugging the “numberOfPoints” variable created by the size of the points query from the lines above it. These particular lines of code will return the number of points that the user clicks on. You can debug things like queries, vectors, lines, planes, and more.
So how do you see the result of using debug? Use your custom feature and click the FeatureScript notices icon in the top right corner.
This launches the FeatureScript notices panel. This panel shows all FeatureScript warnings and errors as well as any debug or println statements from your code. In the screenshot above, you can see “debug:3” in the FeatureScript notices panel. This tells me that the “numberOfPoints” variable we wanted to debug is returning “3.”
But debug can do a lot more than print simple numbers. One of the coolest things you can do with debug is highlight the entity you are debugging in the graphics. For example, when I debug a plane like this:
It highlights the plane in the graphics and gives me the details in the FeatureScript notices panel:
Highlighting in the graphics only works with applicable geometry, and it will only highlight the debugged entity while the feature is being edited. After the feature is accepted, the highlighting disappears. You can highlight faces, lines, coordinate systems, planes, and more.
So the next time you find yourself stuck in FeatureScript, use debug to help you troubleshoot!
Latest Content
- Blog
- Enterprise
- Government (US)
- Commercial (Pro/Standard)
- Collaboration
- Rendering
How Non-Engineering Teams Use Onshape to Move Products to Market Faster
04.08.2026 learn more- Blog
- Customers & Case Studies
- Collaboration
- Education & Universities
- Education
How Bucharest Engineering Students Used Onshape to Build, Publish, and Win
04.07.2026 learn more- Blog
- Drawings
- Sheet Metal
- Surfacing
- Parts
- Model Based Definition
- Rendering
- News from Onshape @ PTC
The Cloud CAD Platform That Continuously Gets Better: March 2026 Highlights
04.02.2026 learn more