7:39
Recently, I’ve been experimenting with Onshape for a few different projects, including designing parts for a microscope and designing jewellery. I often find myself struggling with the limited capabilities of native CAD tools on Linux, so the ability to do CAD work in a browser on any platform is fantastic. And Onshape is not a toy: it has some truly impressive capabilities that can compete with high-end desktop-based CAD systems, and it gets better every few weeks! (Please note that I have no affiliation with the company. I’m just a happy user.)
One feature that I look for in any CAD system is a programming language or extension API. Most CAD tasks have some degree of structure, and I like the idea of writing code to simplify repetitive tasks. For example, when designing jewellery, one frequently needs to design settings for jewels, and it would be a painstaking process to build these each time from scratch. Onshape’s FeatureScript language is brilliant for this: once I’ve written my custom ‘features’ in FeatureScript, they behave as first-class citizens in the Onshape GUI, and I can simply insert a ‘setting’ or ‘prong’ with a given set of parameters.
If you’ve done any programming before, FeatureScript is simple to use. The syntax is quite similar to other procedural languages, so it takes only a few days before it becomes second nature. The documentation doesn’t always tell you everything you want or need to know, but to be fair, there is a wealth of FeatureScript examples you can reference, created by both the Onshape team and from users.
For my designs, I needed to draw a lot of curves (and then offset those curves). While I could do approximately what I wanted in the GUI, it took me a long time to figure out how to do it in FeatureScript as part of my custom features. This article is an attempt to explain some of the missing links for those following in my footsteps. I’ll start with some basic background on splines, then proceed to describe how to draw 2D splines (in a sketch), how to draw 3D splines and how to offset curves.
Basics of Splines
There’s a lot of mathematical jargon around splines and polynomials; I’ll try to use both the technically correct terms and plain English wherever possible.
A spline is a piecewise polynomial. The curve is made up of one or more pieces, where each piece is a polynomial. The polynomials are normally chosen such that they “match up” at the transitions and you end up with something that looks like a single continuous curve. There can be various definitions of “matching up.” So to produce a visually smooth curve, at least the function values and the first derivative need to match (C1 continuity), and usually the second derivative is also chosen to match (C2 continuity).
In the case of Onshape splines used in sketches, the pieces are normally cubic polynomials — polynomials of maximum degree 3 — in two dimensions, x and y. However, I should be more clear what I mean, as there are at least three different things that could be meant by cubic polynomials in two dimensions:
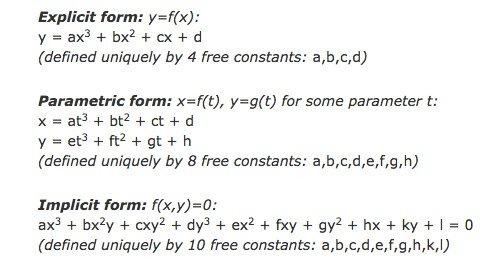
The explicit form can produce, say, a parabola y=x2, but can’t produce a parabola rotated by 90 degrees. Therefore, it makes little sense for software such as Onshape, which must be able to produce curves in any orientation.
The implicit form is the most powerful – in that it can express curves that can’t be expressed in the other two forms – but it is difficult to evaluate the set of points that are part of the curve.
Therefore, as might be expected, Onshape curves are of the parametric type: a curve in two dimensions is produced parametrically by evaluating functions x(t) and y(t) for t from 0 to 1. The functions x(t) and y(t) are splines: there may, for example, be one polynomial piece from t=0 to t=0.5 and one from t=0.5 to t=1. Some of the FeatureScript functions related to curves, such as evEdgeTangentLine() and evEdgeCurvature(), take this parameter t as an argument.
Drawing 2D Splines – Single Polynomial Piece
Splines can be created programmatically in an Onshape sketch using the skFitSpline() function. First, let’s start with a curve with only one polynomial piece between two points (0,0) and (100,100). In FeatureScript, we can write:
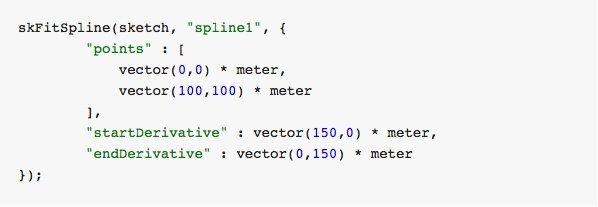
Here is the result:
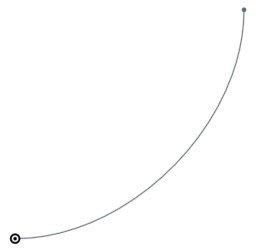
Note that I’ve specified a startDerivative and endDerivative that include the starting and ending direction. If I had only specified a start and end point, then the result would have just been a straight line.
When I was first experimenting with this, my first question was: “Why do the start and end derivatives have length units (in this case, 150 meters)?” With a bit of experimentation, it’s clear that these vectors should be scaled together with the curve, i.e. if we scale the curve up by a factor of two, we should also double the startDerivative and endDerivative. Also, a larger magnitude makes the curve launch with more momentum in the given direction. For example, here is the curve with startDerivative increased to (500 meters,0):
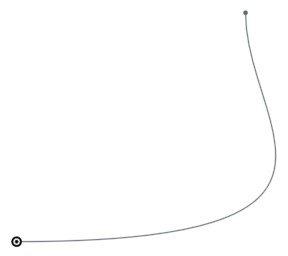
But what does the magnitude of these vectors actually mean?
It all becomes clearer, however, when you consider the curves in parametric form as described in the previous section: x=f(t) and y=f(t). It turns out that the given derivative vectors are the derivatives of (x(t), y(t)) with respect to the parameter t (i.e. (dx/dt, dy/dt)) at t=0 and t=1. If this is too abstract to visualize, there is also a simple mapping to Bézier control points that I’ll explain below.
It turns out that the start point and end point, and the two derivative vectors – four (x,y) pairs in total – uniquely define the eight parameters of the parametric cubic polynomial. Thus, any parametric cubic polynomial can be specified in this way.
Drawing Bézier Curves
If you’re familiar with Bézier curves, the above discussion will sound familiar. A Bézier curve is defined by four control points (call them P1, P2, P3, P4). The curve launches from P1 in the direction of P2, and then approaches P4 from the direction of P3. If P2 is further away from P1, then the curve launches with more momentum in the given direction.
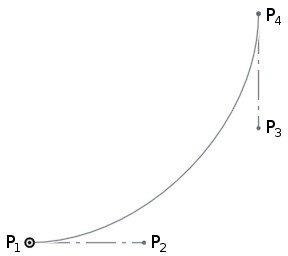
It turns out that these formulations are equivalent with a tiny amount of math, and if you have the Bézier control points, you can calculate the required startDerivative and endDerivative as:

where Δt will be 1 for the simple case that t varies from 0 to 1 across the curve segment, and the 3 arises from the degree of the polynomial (because d/dt(t3) = 3t2). Thus, for a single-piece spline, the startDerivative and endDerivative will be three times the distance to the corresponding Bézier control point.
Of course, you can also calculate the Bézier control points from the startDerivative and endDerivative by rearranging these equations for P1 and P2:

Evaluating Splines in Onshape
You can evaluate the spline at any point using the evEdgeTangentLine() function in FeatureScript, providing the parameter value t (from 0 to 1). The Line object that is returned has an origin that provides the evaluated point and has a direction that is tangent to the spline.
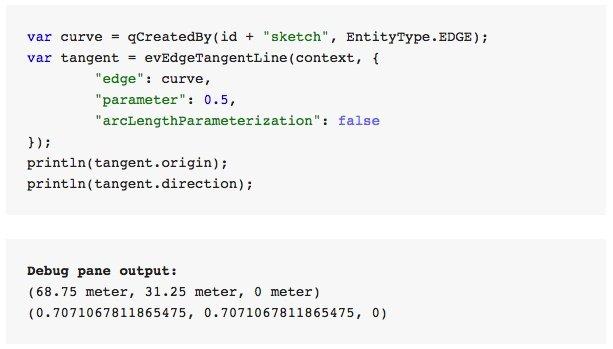
This can be useful for performing further geometry calculations after drawing a spline. For completeness, I’ll note that there is also a evEdgeTangentLines() function — which is identical but allows evaluating the curve at multiple points in one call — and an evEdgeCurvature() function — which returns not only a tangent but also normal and binormal vectors.
Drawing 2D Splines – Multiple Polynomial Pieces
Now let’s add another point to the spline:
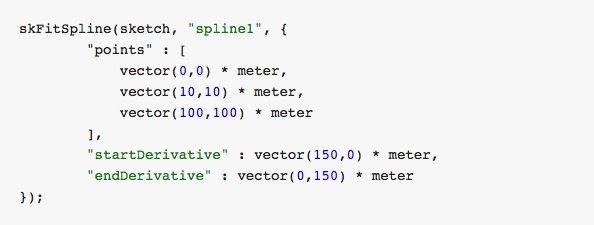
Here is the result:
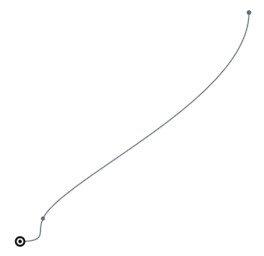
Now there are two polynomial pieces, one that goes from (0,0) at t=0 to (10,10) at t=0.25, and one that goes from (10,10) at t=0.25 to (100,100) at t=1. The breakpoint between the two – called a knot – is at t=0.25.
Why is the knot at t=0.25? Well, this knot could actually be placed anywhere in ‘t space,’ for instance t=0.1 or t=0.5, but as the second piece of the curve is much longer, there is an argument for assigning more ‘t space’ to the second piece. Onshape uses the square root of the chord length between points as the metric; the lengths of the two chords here are 14.1m and 127.3m so the knot location is chosen as sqrt(14.1m)/(sqrt(14.1m)+sqrt(127.3m)) = 0.25.
The polynomial pieces are chosen such that both the first and second derivative are continuous through the middle point, which uniquely defines the two polynomials. Note that if you only care about first derivative continuity and not second derivative continuity, then you can actually get a larger variety of curves by drawing the two parts individually. Then you can choose any value for the piece1 endDerivative and piece2 startDerivative as long as the direction matches.
Interested in Even More Spline Talk?
It’s time to take a breather, but I’m far from done talking about splines. In Part 2 of this blog, I will explore B-Splines (contrary to popular belief, there’s nothing voodoo about them), Offset Curves and much more! Stay tuned...
Latest Content
- Blog
- Becoming an Expert
- Assemblies
- Simulation
Mastering Kinematics: A Deeper Dive into Onshape Assemblies, Mates, and Simulation
12.11.2025 learn more
- Blog
- Evaluating Onshape
- Learning Center
AI in CAD: How Onshape Makes Intelligence Part of Your Daily Workflow
12.10.2025 learn more
- Blog
- Evaluating Onshape
- Assemblies
- Drawings
- Features
- Parts
- Sketches
- Branching & Merging
- Release Management
- Documents
- Collaboration
Onshape Explained: 17 Features That Define Cloud-Native CAD
12.05.2025 learn more


